Part 2: Free Drug Principle and Potency
October 5th, 2025 By John Widen
A couple weeks ago
I wrote about the free drug principle
(also referred to as the free drug hypothesis, but it isn’t a hypothesis anymore).
I gave an overview of why the free drug principle is important to consider
when interpreting potency and DMPK data. The article was a broad overview,
but I mostly focused on applying free fraction corrections to determine brain
penetrance (Bu/Pu or Kp,uu,brain). Please,
check it out if you haven’t read it and are interested in bringing meaning to
your in vivo PK and PD experiments. However, I glossed over some details
about correcting potency values (e.g. IC50 and EC50) with free
fraction measurements. So, here is part 2 of the free drug principle series to cover
some of those details!
There are many publications that report primary assay XC50 values.
Free fraction corrections are very rarely mentioned, but in many cases that is okay.
Determining the free fraction of each compound is not necessary.
It also only matters if your potency assay contains other proteins that
could lead to non-specific binding such as fetal bovine serum (FBS),
albumin, or lysate. Many primary assays are not cell-based and that makes
life easier, but most projects have downstream efficacy assays
that are and that is when you at least have to consider free
fraction to correct for potency. Protein binding is a typical contributor
to potency shifts often observed when comparing XC50
values between biochemical and cell-based assays.
Before you freak out about the 10-fold shift in potency, check the FBS binding.
It will likely explain much of the difference.
Correcting potency with free fraction is easy. Take the free fraction (fu) value times the XC50. And you are done.
The equation is below. The free fraction is measured by putting your compound in whatever matrix is used for your assay. As mentioned above it is
typically 10% FBS or something similar.
- XCxx,u = XCxx x fu
- Unbound potency = potency x free fraction
Many series don’t have significant binding in 10% FBS, which for those who are unfamiliar,
is the typical mix of cytokines that is added to cell culture to induce proliferation and generally
keep the cells happy. But, you’ll never know if you do not check it. I think it is good practice to
at least spot check free fraction in your assay matrix,
especially if some trends in the SAR don’t make sense or seem a little off.
Correcting for potency before you test your molecules in vivo to
estimate target engagement is highly recommended unless you are absolutely
confident that your series doesn’t have higher than 2-fold free fraction correction.
In other words, if your free fraction (fu) in FBS is higher than 0.5.
However, free fraction is a cheap assay and most animal experiments are not.
So, if you want to determine as accurately as possible that the target is being
covered at the desired level (e.g. IC90 for the duration of the experiment),
it is best to get free fractions.
The take home message is to at least spot check the free fraction for molecules within a series to determine
if free fraction is an important parameter for data analysis. This only applies to assays with protein containing matrix.
There are also plenty of projects that involves chemical matter with high non-specific protein binding.
I’m talking about molecules that have free fractions below 0.3 in FBS or below 0.1 in plasma.
These molecules typically have high LogD values (> 3.5). These numbers aren’t strict cutoffs
but when I see numbers close to this alarm bells go off in my head to consider how free fraction
might be distorting SAR or other measurements. Having highly bound compounds can make the interpretation
of potency and DMPK data challenging. I’ve had the pleasure of working on such a project and it required
getting free fraction values to correct for in vitro clearance values (CL) and cellular potency.
Before we started correcting these data there were weird discrepancies. For example,
some compounds would have changes that wouldn’t be expected to improve CL values, but they did.
These compounds had free fractions below 0.2 and were therefore simply being protected from
metabolism through non-specific binding. Correcting the CL values by dividing by the free fraction
in the microsome matrix corrected these discrepancies. So, if you are working with high LogD
compounds and are surprised by the clearance values or other DMPK parameters, check the free fractions.
It will likely explain why that horrible looking compound with a LogD of 4.5 appears to be
metabolically stable.
I’m not implying that a highly bound compound can’t make it to the clinic.
There are many examples. Sometimes being highly bound is desirable! It really depends
on the drug target, target tissue, etc. One recent example is the HIV capsid inhibitor,
Lenacapavir. The medicinal chemistry efforts leading to the discovery of Lenacapavir was
published by Gilead in the Journal of Medicinal Chemistry this past week.
The drug label has the plasma protein binding listed as > 98.5% bound.
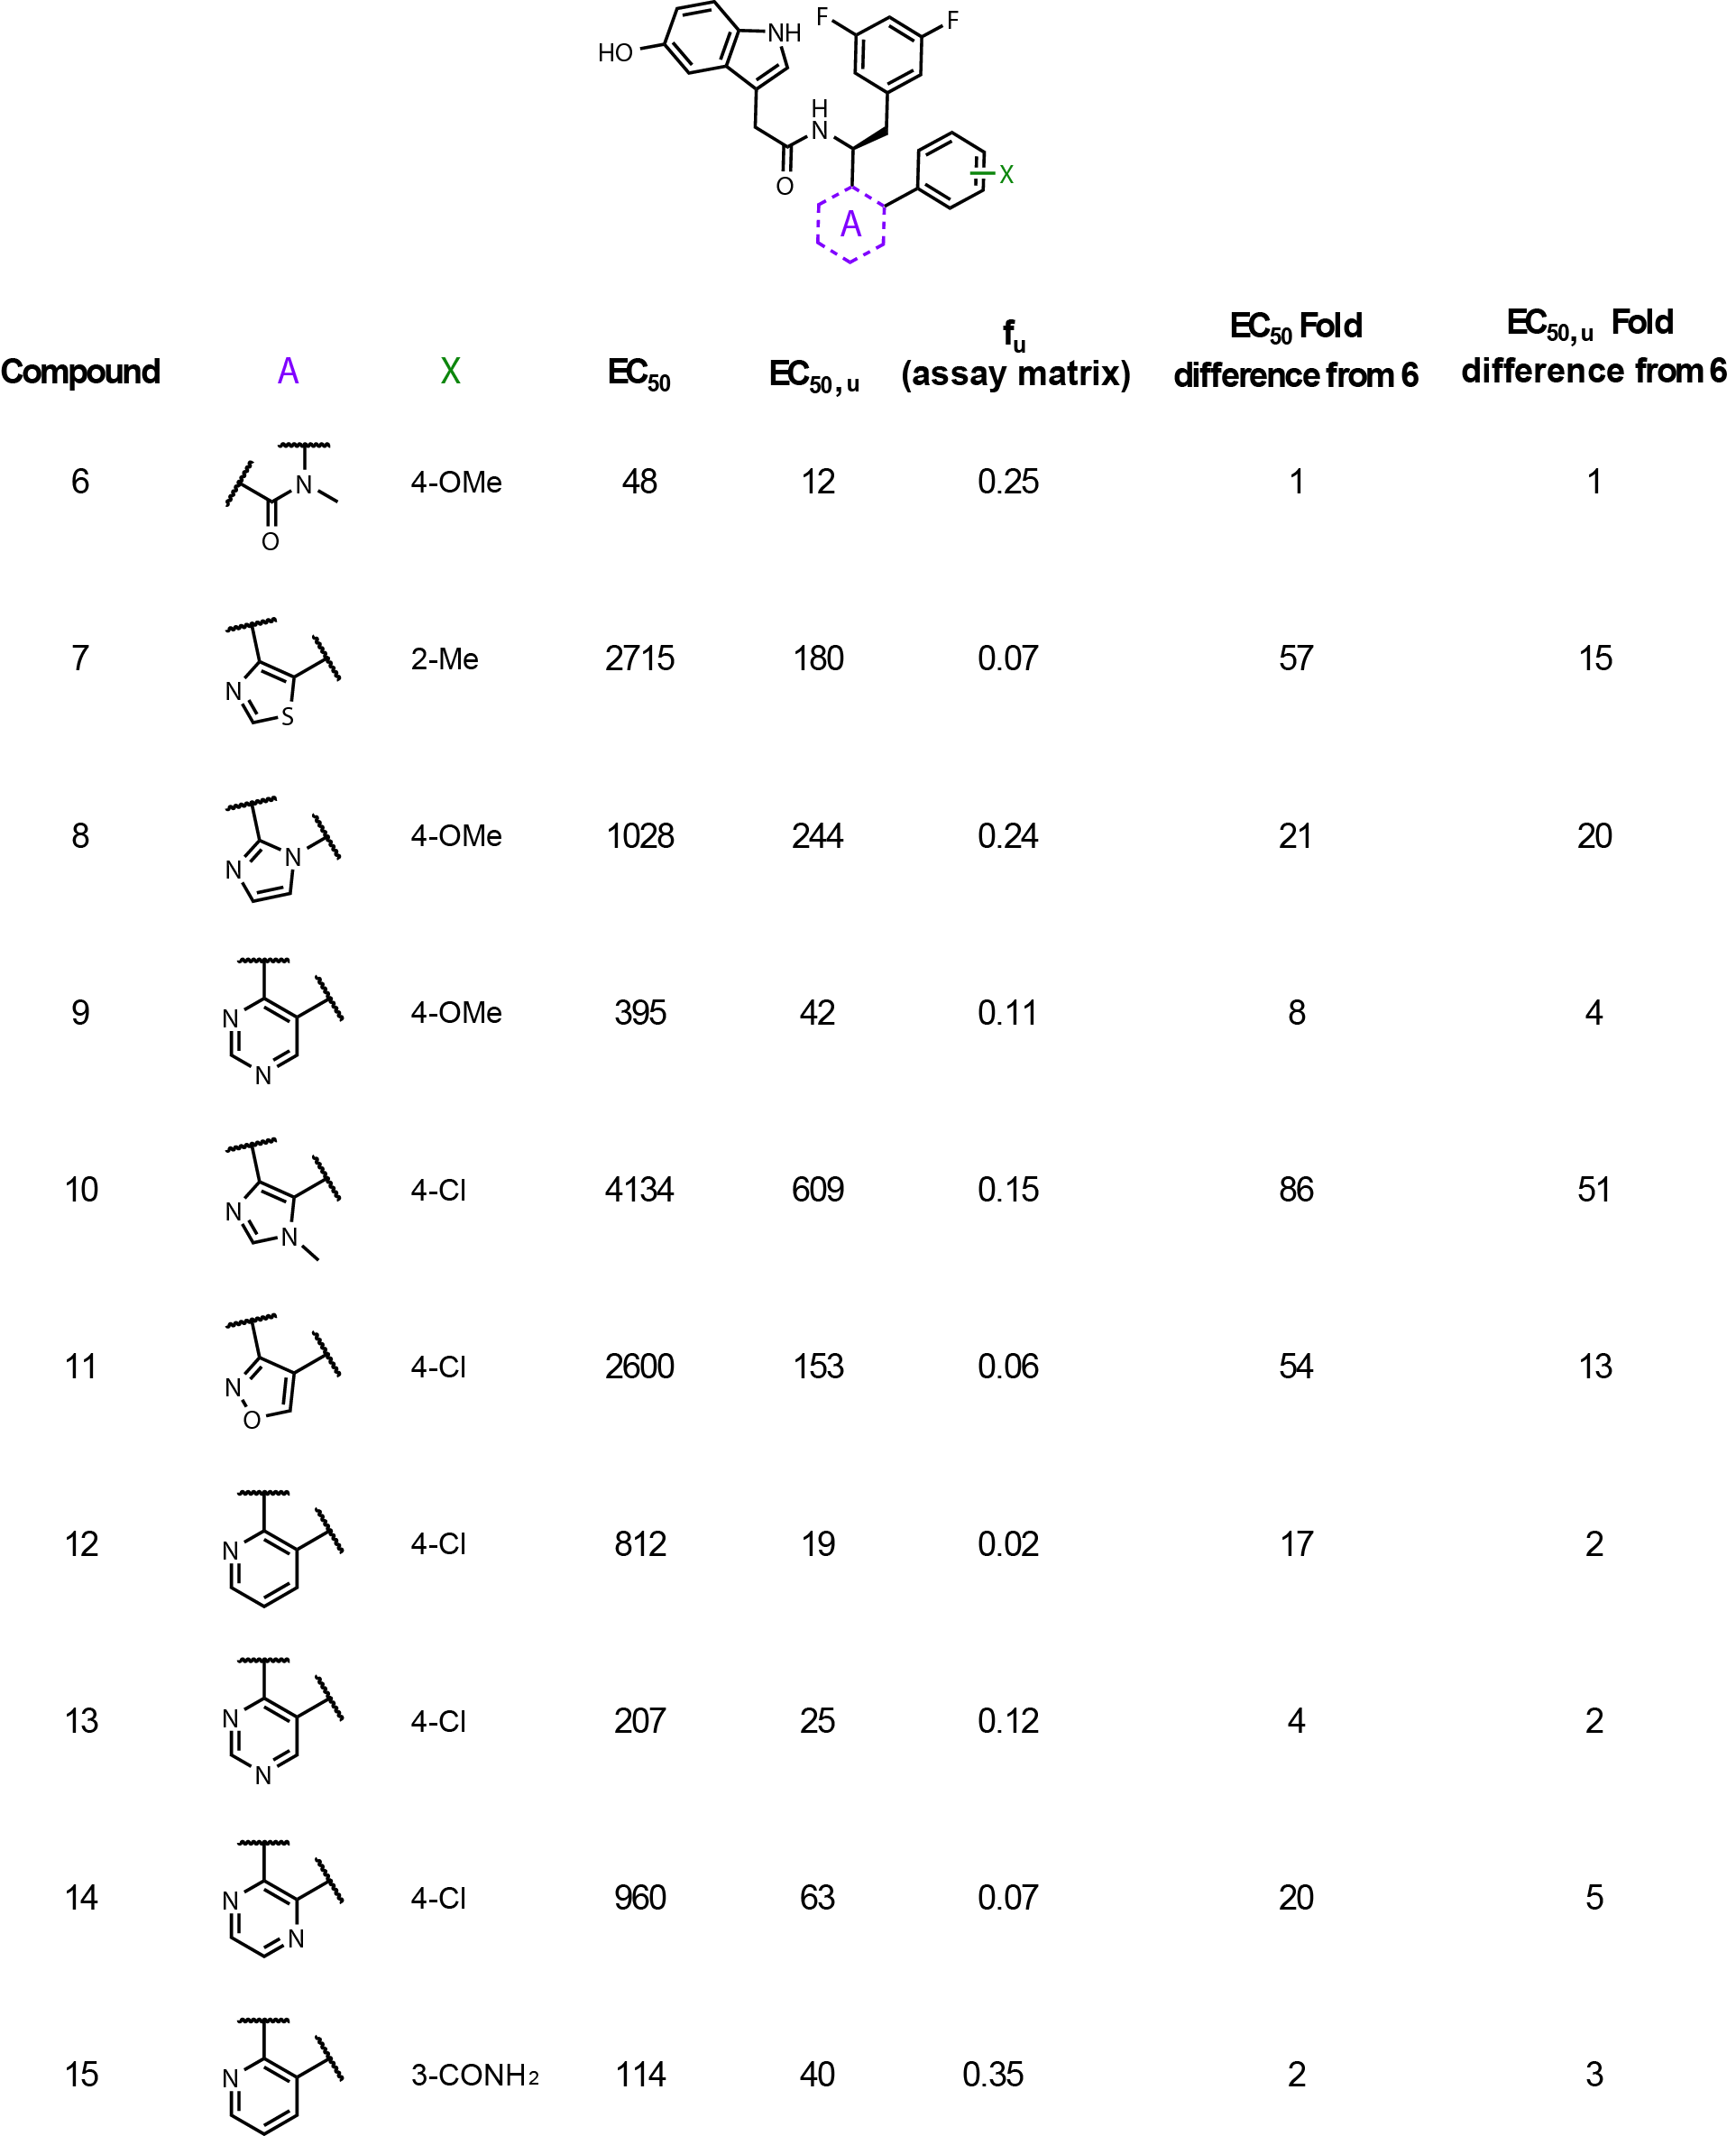
Back calculating the fu values from the Table 3 SAR table in this publication
provides a good demonstration as to why correcting potency values is important (Fig. 1).
The unbound fractions (fu) in the assay matrix range from 0.35 to 0.02!
That is a very large range and can easily throw off the interpretation of the data.
Notice compounds 12-14 have very different fold changes from the parent compound 6
between corrected and uncorrected potencies. Without correcting for matrix binding,
one might conclude that these three molecules lost a significant amount of potency,
but in reality, they are just highly bound and only lose 2 to 5-fold.
This table is a perfect example of why correcting potency values is important.
The publication also describes the potency values of Lenacapavir
(Compound 1 in the publication) in cell-based HIV infectivity assays.
Calculating the free fractions from their bound and unbound EC50
values show that the molecule is 90% bound in the assay media (likely 10% FBS),
which represents a 10-fold difference in potency. Lenacapavir is exquisitely
potent with potencies in the 10-100 pM range! We all dream of that kind of potency.
So, one might think regardless of the fold change the molecule is still very potent.
But, if this same thing were to apply for a less potent molecule in the 10-100 nM range,
this might be more alarming if free fraction is not considered.
The uncorrected potency values of this type of compound would be in
the high 100-1000 nM range. Remember to always consider free fraction when comparing potencies.
There are plenty of other recently approved drugs that are highly bound.
Resimetirom (Rexdiffra) was approved in 2024 for NASH with liber fibrosis and
is listed with a PPB (plasma protein binding) of > 99% bound.
Two others include Tovarafenib (Ojemda/Voranigo) (PPB: 97.5%) and Aprocitentan (Tryvio) (PPB > 99%),
which have difficult to pronounce names, but are also highly bound molecules that were approved by the FDA in 2024.
I mentioned this in the last article about free fraction, but I’ll reiterate it here: Do not optimize for free fraction.
There is a fine line between optimizing for free fraction and physicochemical properties.
Lowering LogD and introducing polarity into a molecule can improve metabolic stability,
avoid off-target risks, and potency. LogD can also influence free fraction values.
But other properties and functional groups contribute to non-specific protein binding as
well including hydrogen bond donors/acceptors (HBDs/HBAs), carboxylic acids, protonatable
amines, and the general shape of the molecule. Sometimes, molecules are highly bound and that can be okay.
Working with highly bound compounds can be a pain.
However, the typical methods using
dialysis or ultracentrifugation
can accurately determine free fraction.
There are definitely times where the accuracy of the free fraction values are called into question.
Probably to the chagrin of DMPK experts everywhere. But, these two workhorse methods typically
provide reliable results within 2-fold of each other. There are other techniques that exist such
as the dilution method where the compound is simply diluted in the matrix by 10, 20, 50, and
100-fold using the same dialysis method. The idea is that the free fraction shouldn’t change
much as the compound gets diluted. If it does, then there might be another issue going on,
like non-specific binding to the surface of the plates or tubes, or incompatibility with the
extraction solvent. I’m not an expert in this, but if (and when) you doubt the accuracy of a free
fraction, talk to your DMPK expert. They’ll probably roll their eyes and mumble “here we go again”,
but maybe you can talk them into double checking the measurement.
If you want to dig deeper on free fraction values and the free drug principle,
I recommend
this perspective in
J. Med. Chem. that provides examples and explanations
as to why considering free fraction for potency and PK parameters is important.
It has a nice explanation as to why free fraction should not be optimized,
which couldn’t be stressed enough.
Since I am on the topic of potency,
I wanted to discuss briefly the interpretation and comparison of potency values.
When comparing potencies there is an error associated with each value.
Assays are typically run at the same time in replicates of two or three (technical replicates).
And then the assay is repeated at least one more time in a different run for two biological replicates.
The difference in values for the same molecule between these replicates can be
reported as standard deviation or standard error for potency. However, error calculations
are almost never given in publications.
Going back to the Lenacapavir publication,
the authors do not disclose error measurements for potencies.
I’m confident that these values are available and were considered when
comparing potencies, but when they aren’t reported in a publication it is
impossible for the reader to determine if two- or three-fold difference in
potencies is significant. Typical standard deviation of an assay is between 2- to 3-fold.
So, seeing 3-fold changes or higher as significant is usually a good assumption when error
values are not reported. Maybe this is by design to avoid disclosing too much information
about a drug discovery program. But it would be great if journals required standard errors
associated with ANY measurement. You would think that a PRESTIGIOUS journal such as the
Journal of Medicinal Chemistry would make such a requirement.
I think calculating and using error values is rigorous science.
But here we are.
There are countless times when I would get excited about a
potency of a molecule after one replicate only to find that the following
week the second measurement is three-fold higher. When this happens,
I usually ask for the molecule to be tested a third time to get a standard error
across three biological replicates. This can be hair splitting sometimes, but standard error measurements are important to consider for SAR. I think it is a common mistake for scientists to see a two- to three-fold potency gain and immediately think this is significant in a statistical sense without running a T-test.
I’m not going to launch into writing about statistical analysis. Without going too much into the details, I will just say that when evaluating potencies for SAR, it is good to know the consistency and limitations of the assay. Misinterpretation of data can lead to wasting time and resources on molecules that don’t contribute to potency gains or improvements in DMPK properties. Statistics are deeply engrained and are absolutely necessary to understand in science. There is a lot more to discuss in terms of evaluation and comparison of potency values or DMPK parameters. It seems like there will be a part 3 to this blog series! Suffice it to state for now that when comparing any values between molecules make sure to consider error in the measurements. I’ll stop there, thanks for reading.
Correction: A previous version of this article said Pfizer instead of Gilead published the discovery of Lenacapavir.
The take home message is to at least spot check the free fraction for molecules within a series to determine if free fraction is an important parameter for data analysis. This only applies to assays with protein containing matrix.
The site does not have a comments section yet! Hopefully, very soon! Until then please drop me a line at jwiden@chemjam.com. If you provide comments on my articles I reserve the right to post them on this website as additional commentary. My goal is to have an open discussion!